
Gold spent the first days of October doing what it has done all year: refusing to pick a direction and daring you to trade it anyway. The intraday reads this week depended entirely on which clock you looked at, and the official sector kept buying underneath all of it.
Two prices, same day
Start with the tape. CNBC had spot gold at 4,218.01 dollars per ounce at 9 a.m. ET on October 2. That was up from 4,180.59 at the same hour on October 1 and 4,207.81 on September 30. So on the morning read, gold was firming into the new month.
Then look at the afternoon. Kitco marked the metal at 4,136.60 per troy ounce at 1:13 p.m. ET on October 2, down 39.90 on the day. Same date, a roughly 80-dollar gap between the morning CNBC print and the early-afternoon Kitco mark. That is not a data error. That is a market swinging in an 80-dollar band inside a single session. For anyone quoting scrap or settling bullion off a fixed reference, that kind of intraday range is the real risk, more than the direction itself.
I point this out because clients see one headline number and assume the price is a fixed thing. It is not. Between venues and hours this week, gold moved enough to change a refining quote materially. If you are buying over the counter, the spread you get depends on which minute of which afternoon you print the ticket.
The buyers who do not watch the tape
Underneath the daily chop sits the demand that has defined this entire run, and it does not care about an 80-dollar intraday swing. Central banks bought a record 288.9 tonnes in the second quarter of 2026 according to the World Gold Council. That is official-sector demand at a level the market has rarely seen, and it is the structural bid that keeps pullbacks shallow.
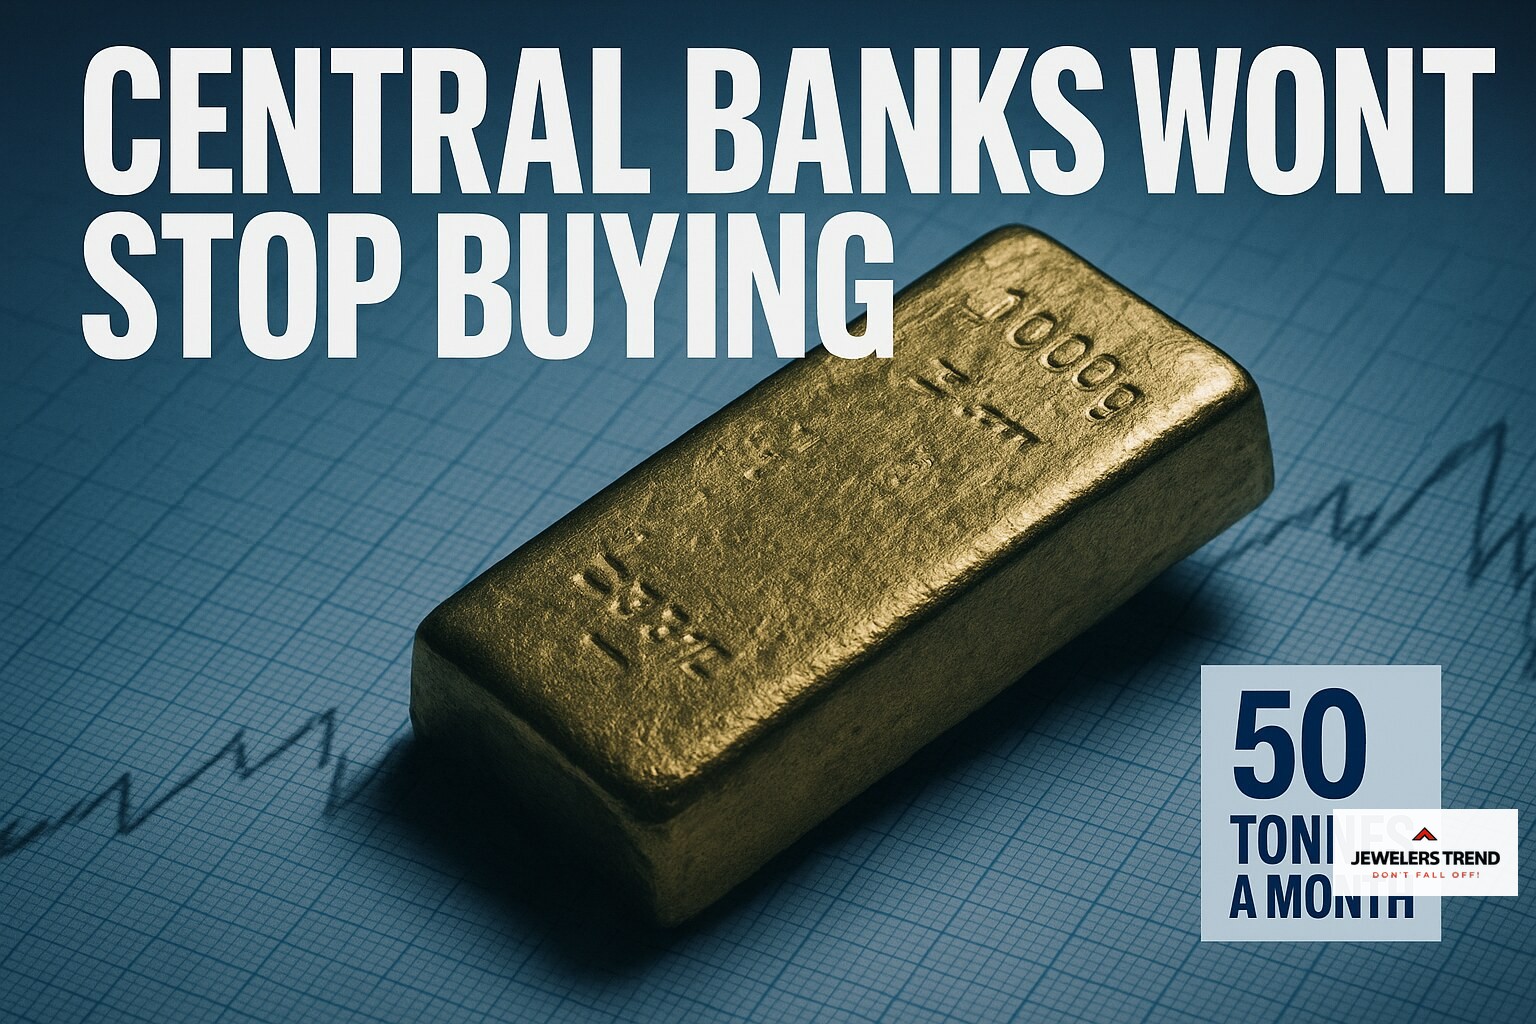
Goldman Sachs Research expects that pace to continue. The bank looks for central banks to average 50 tonnes of gold per month across 2026. For scale, Goldman notes official buying ran around 17 tonnes a month before 2022. So the current pace is roughly three times the pre-2022 norm, sustained quarter after quarter. When a buyer that size is in the market every month regardless of price, the dips get bought and the floor keeps rising.
What it means at the bench
For the trade this cuts two ways. On one side, a metal churning in 80-dollar intraday bands is a headache for anyone holding gold as working inventory rather than as a position. Your scrap margins and your showcase pricing both move faster than you can reprice tags. On the other side, the central-bank bid is about as reliable a backstop as this market offers. A record 288.9 tonnes in a quarter and a 50-tonne monthly run rate for the year is not the setup for a collapse.
That backdrop also frames the rest of the trade this cycle. The diamond index turned higher in August, which I cover in the diamond column, and the week's auction results ran hot, as detailed in the weekly wrap. Firm gold, firming diamonds, and record auction hammers are a reasonably constructive combination heading into the fourth quarter.
The number that matters
Strip out the daily noise and two figures tell the story. Central banks bought 288.9 tonnes in the second quarter, a record, and Goldman sees 50 tonnes a month all year against a pre-2022 norm near 17. As long as that official demand holds, the 80-dollar swings between a CNBC morning and a Kitco afternoon are just weather. The question for the fourth quarter is whether the official buyers keep their pace if spot pushes into new ground, or whether even they start to flinch at the price they helped build.





Comments 0
No comments yet. Be the first to share your thoughts.