
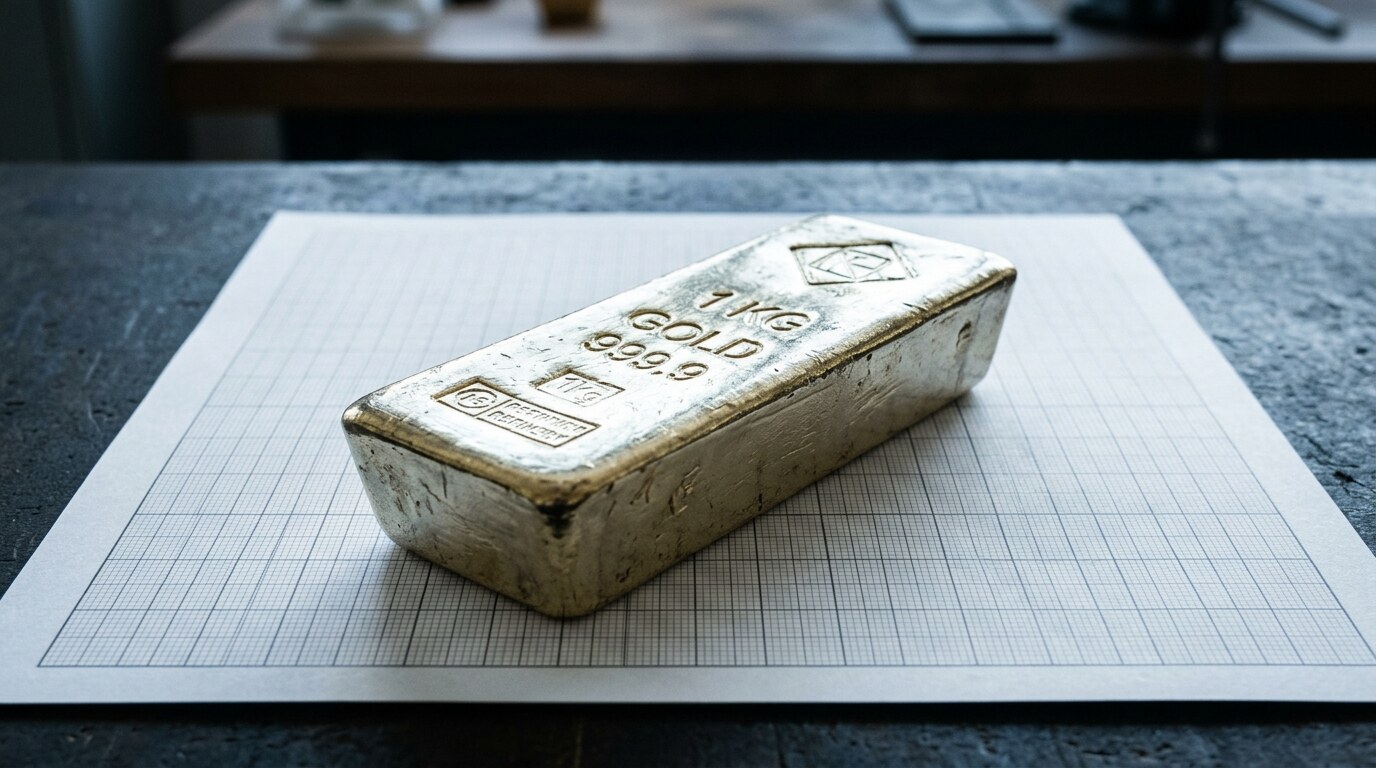
Gold closed the week at $4,470.66 an ounce on September 4, down a negligible 0.07% on the day. The flat close undersells the strength. Over the past month the metal has added 5.26%, and it is up 24.44% against the same week last year. The intraweek prints show the range that flat number hides: CNBC had spot at $4,489.80 the morning of September 3 and $4,335.79 the morning of September 2. A $150 swing inside two sessions, and buyers still closed the week above $4,470. That is not a market that panics on a pullback.
The official sector is the whole story
This bid is not built on retail bars or trend-following funds. It is central banks, and June was a step change. Purchases accelerated to 100 tonnes a month on a three-month seasonally adjusted basis, up from 66 tonnes the prior month. For context on how far above trend that runs, Goldman Sachs Research models an average of 50 tonnes a month across all of 2026. June doubled that pace, which is the kind of divergence from trend that moves a price even when the daily headlines are quiet.
The quarterly data confirms it is not a one-month blip. The World Gold Council reported a net 288.9 tonnes purchased in the second quarter, a 62% increase year over year and the strongest second quarter it has on record. Poland, China, Uzbekistan, Kazakhstan, and the Czech Republic ranked among the largest buyers, and the breadth matters as much as the total. Total first-half purchases reached 345 tonnes. When official buyers absorb that kind of tonnage across that many countries, the dips get taken out before the rest of the market finishes reacting, which is exactly what the price action under $4,500 looks like this week.
Why the floor keeps rising
The mechanics matter to anyone holding metal on the books. Central-bank demand is price-insensitive in a way private demand is not. A reserve manager diversifying out of dollars does not wait for a pullback, and does not sell on a rally. That behavior is what puts a rising floor under the market and why a 5.26% monthly gain has not brought out the kind of selling that usually caps a speculative move. The 24.44% year-on-year gain is the cumulative result of that steady, size-driven accumulation, one month layered on the next.
It is also why the metal shrugged off the $4,335 print on September 2 and was back near $4,490 a day later. There is a level under this market where official demand reengages, and right now it sits north of $4,335. For a dealer, that changes how you carry inventory: the risk of holding metal through a $150 intraweek swing is smaller when you know who is buying the bottom of it. That same official-sector bid was the anchor in this week's trade wrap.
None of that makes the metal immune to a correction. Official-sector demand sets a floor, it does not cap the upside or rule out a sharp pullback if positioning gets crowded. But it changes the character of the dips: they get bought rather than extended, which is why $4,335 held and $4,470 closed the week.
What to watch
The number that decides the fourth quarter is not the daily spot print, it is the July central-bank data. If the 100-tonne June pace was a pull-forward, the monthly figure reverts toward the 66-tonne prior reading and the metal loses its most reliable buyer at the margin. If July confirms the acceleration, the 345-tonne first half puts 2026 on track to challenge the record annual totals, and $4,470 starts to look like a base rather than a ceiling.
For the trade, high and stable gold cuts two ways. It lifts scrap and bullion margins and keeps the refining flows busy, but it pressures the metal cost of every finished piece, a squeeze the branded-jewelry side is managing through price, as covered in the industry rundown. A goldsmith cannot pass through a 24% metal move overnight, so margins on made goods compress until retail prices catch up. For refiners, that stability is worth more than a higher price that swings. The open question is whether June's 100-tonne pace holds. Watch the July World Gold Council print. That is the tell.





Comments 0
No comments yet. Be the first to share your thoughts.