
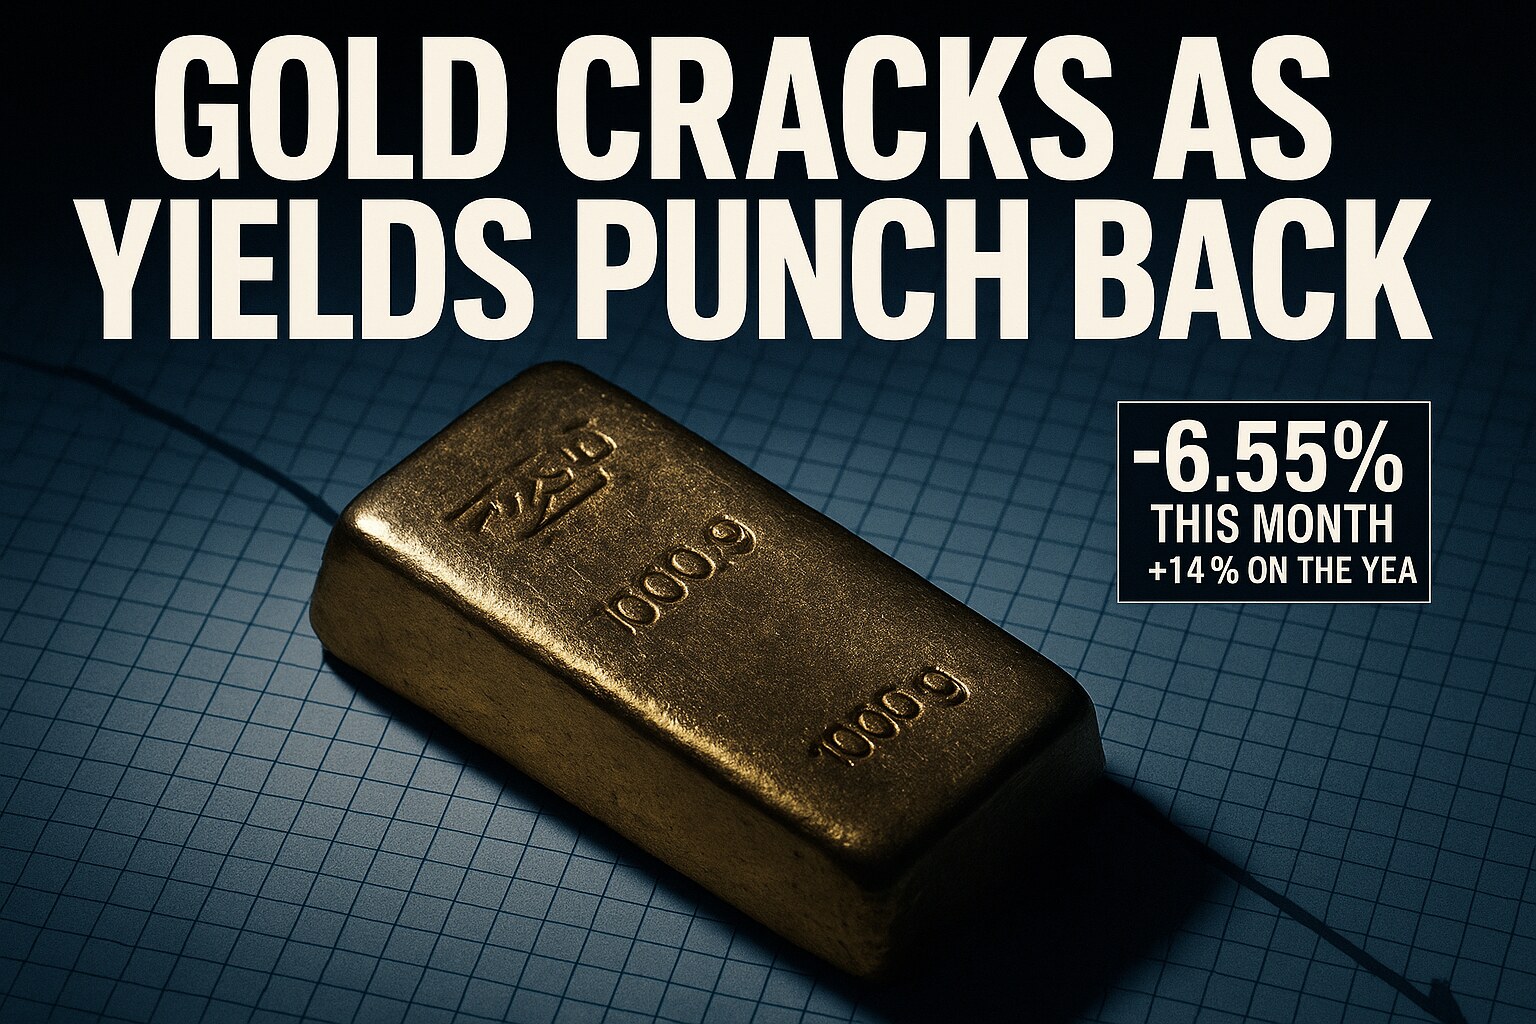
Gold sat around $4,270 an ounce on Friday, September 25, heading for a weekly decline of more than 2%. The spot reference printed at $4,293.06 earlier in the session, up a slim 0.43% on the prior day, but the week's arc was lower. Zoom out and the picture is a metal cooling off from a very hot run: gold is down 6.55% over the past month, yet still 13.91% higher than it was a year ago. This is a pullback inside an uptrend, not a top.
What did the damage
The move was macro, not anything born in our trade. A stronger dollar and surging Treasury yields pressured the metal as the market lifted its Fed rate-hike expectations. That is the classic setup for a gold selloff. When yields climb, the opportunity cost of holding an asset that pays no coupon climbs with them, and the tactical money that piled into bullion as an inflation and uncertainty hedge starts rotating toward paper that actually pays. None of that touches the reasons the metal ran in the first place. It just changes the near-term math for the fast money.
Context matters on the drawdown. Gold set an all-time high of $5,597.23 on January 29, 2026. From that peak, a slide to the low $4,000s is a meaningful correction, but the metal is doing it from an altitude that would have seemed absurd two years ago. A 6.55% monthly pullback after that kind of ascent is the market letting out air, not the structural bid failing.
The floor under the market
That structural bid is the official sector, and it has not gone anywhere. The World Gold Council put Q1 2026 net central bank purchases at an estimated 244 tonnes, and Q2 buying at 288.9 tonnes. July added 23 net tonnes, with China marking its 21st consecutive month of purchases. The monthly cadence has been extraordinary: Goldman Sachs Research clocked June buying accelerating to 100 tonnes a month on a three-month seasonally adjusted basis, up from 66 tonnes in May, and expects central banks to average 50 tonnes a month across 2026, against roughly 17 tonnes a month pre-2022.
That is the number that keeps me constructive through a week like this one. A tripling of the baseline official-sector bid, from 17 tonnes a month to a projected 50, is a demand pillar that does not care what the two-year Treasury did on Thursday. These buyers do not chase price. They accumulate on weakness and they run multi-year programs. China at 21 straight months is not trading a chart. It is executing a reserve-diversification policy. When the tactical layer sells off, as it did this week, that is exactly the environment in which the floor buyers step in.
Reading the pullback
So how should the trade read a 2% down week? As a test, not a trend break. The speculative layer that rode gold from the spring into the summer is the layer that came off this week on the yield move. The question is whether the official-sector floor absorbs the supply the way it has all year. If the WGC's next monthly tally shows central banks buying into this dip, the correction resolves higher. If the July pace of 23 tonnes softens materially while yields keep climbing, then the tone has genuinely shifted and $4,270 is not the bottom.
My base case leans on the structural side. A metal that is still up nearly 14% year on year, backed by an official bid running near 50 tonnes a month and a country buying for 21 straight months, does not typically unravel on one hawkish repricing of Fed expectations. The dollar and yields can push gold around week to week, and this week they did. The floor decides where it stops. For how this pullback sat against the rest of the tape, the diamond turn and the Swiss run are covered in the trade week wrap, and the retail demand read is in the industry report.
The one figure I will be checking first next week is the next central-bank tally. If it prints above the July 23-tonne pace, this dip is a buying opportunity. If it drops off, I will revisit the whole thesis.





Comments 0
No comments yet. Be the first to share your thoughts.